
See what's running now, without making calls.
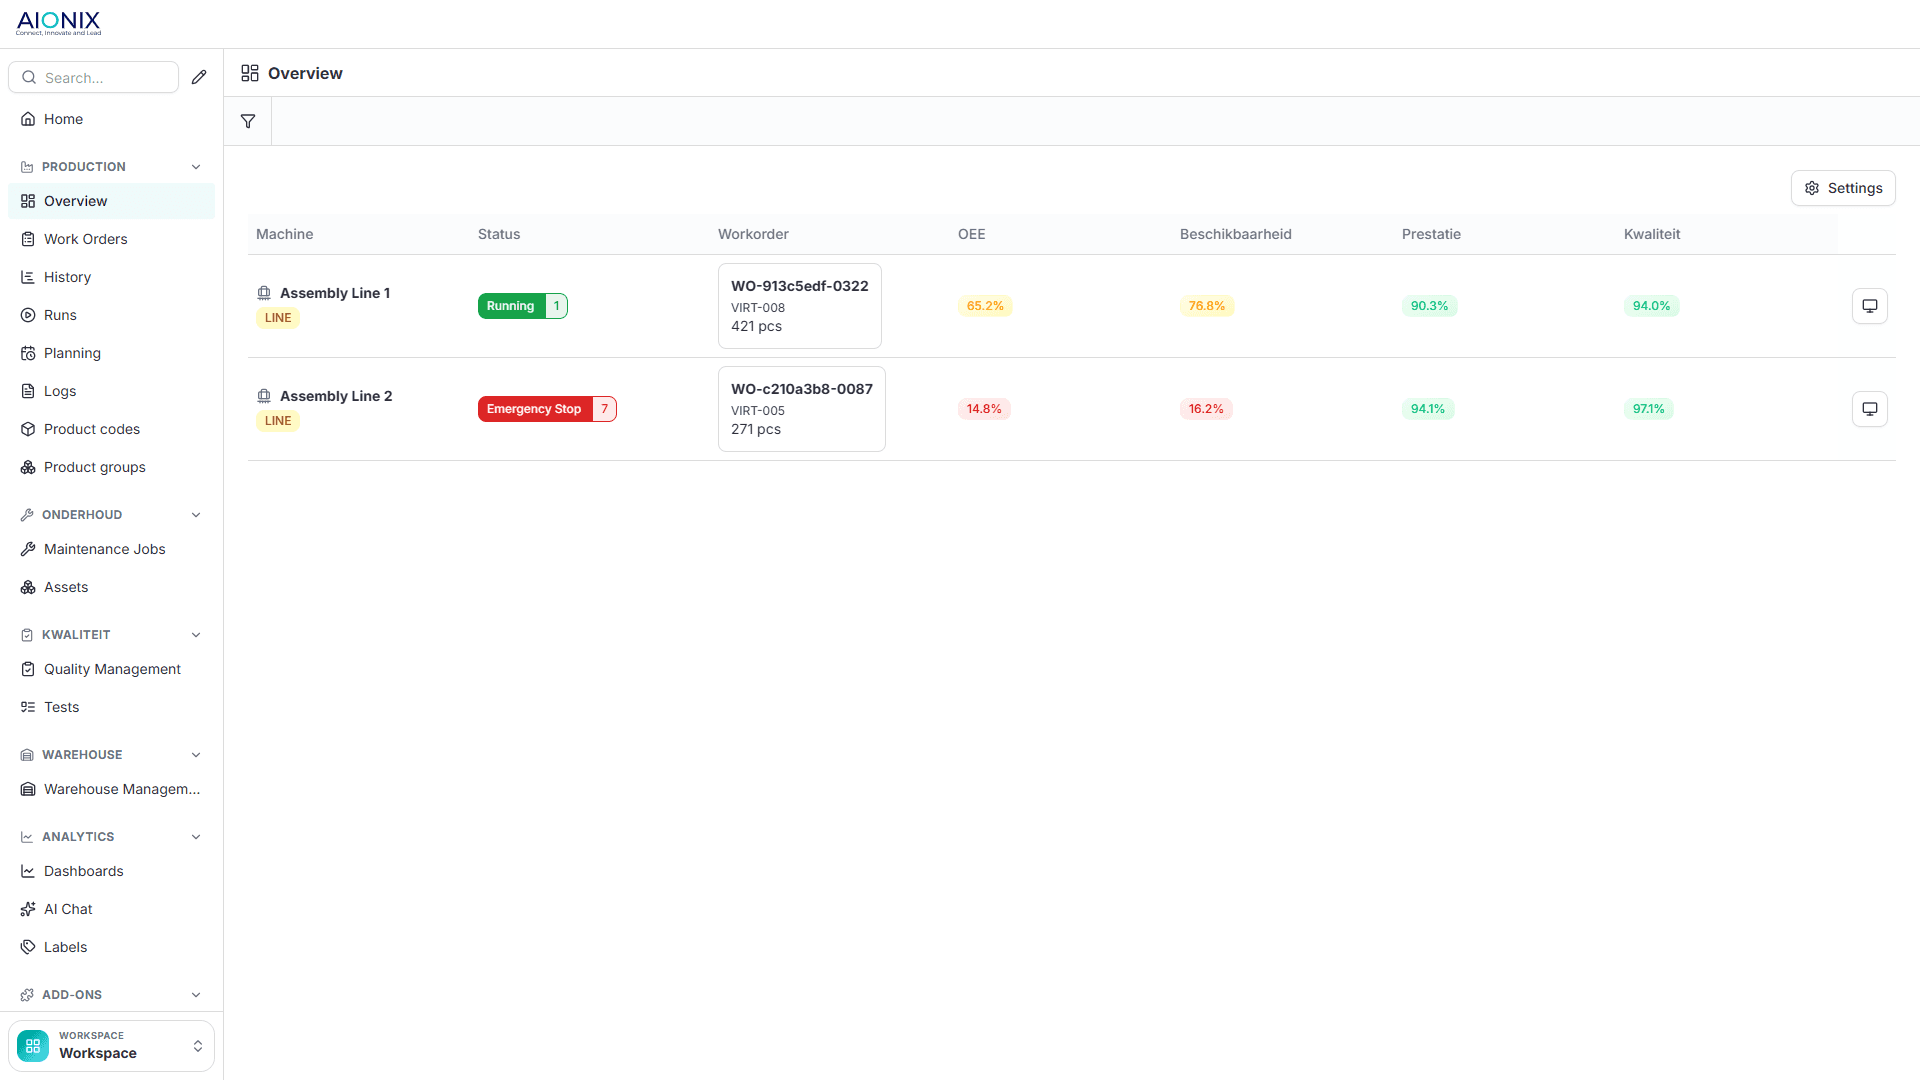
Solution 02 · Production moduleOne overview per line: which order is running, how much is done and whether you'll make the date. You see it from your desk, the floor sees the same thing.
From making calls to one look at the screen.
- You call the floor to find out how far an order has got.
- The counter on the machine doesn't match what's in the system.
- You spot a delay only when the customer calls about it.
- Per machine: which order is running, how many parts are done and how many to go.
- If an order runs late, you see it while you can still act.
- Your production report is ready at the end of the shift.
This is how it looks in the AIONIX portal.
Three steps, one line at a time.
Measure
We mount a device on the line that counts parts and detects downtime. The machine itself stays untouched.
Connect
The order from your ERP is tied to the machine, so you see progress per order instead of loose counters.
Monitor
One overview on your desk, one screen at the line. Same figures, no argument.
The kinds of downtime you learn to tell apart.
The value is not in recording that a line stopped, but in telling the kinds of stop apart. This is the split we usually start from.
| Kind | What it is | Why it stands on its own |
|---|---|---|
| Breakdown | The machine fails and someone has to attend to it | This is what maintenance picks up. Without its own category it disappears into the total |
| Changeover | A switch to another product or format | Belongs to your product mix, not to machine reliability. Added together, your line looks worse than it is |
| Microstop | Shorter than the threshold you set, often a few seconds | Shows up on no paper sheet at all, and added together is often the largest item |
| Speed loss | The line runs, but slower than the standard | Not downtime, so you see it nowhere until you put the standard beside it |
| Planned downtime | Break, maintenance, no order | Does not count as loss. Counting it measures your shift roster instead of your line |
You set the microstop threshold yourself. Too low and the operator drowns in prompts, too high and the biggest loss stays invisible.
The same line, four different questions.
Sees their own line
Whether the line is ahead of or behind what was planned, now instead of tomorrow.
Sees all the lines at once
Where it has stopped, and where it runs slower than it should.
Looks for the cause
From a dip in the figures to the downtime, the order and the hour it started.
Decides on figures
Before you buy more capacity: first see what is still in the lines you have.
Four questions about production monitoring.
What is the difference with OEE?
Do we have to connect all our machines?
How soon do we see anything?
Is this monitoring our people?
What production monitoring gains from the rest.
Production is one module of the MOM platform. The figures above tell you what happened; the modules below tell you why.
Maintenance
On its own, downtime is a bar on a timeline. Add maintenance and that bar carries an asset, an intervention and a history, so you can see whether the same machine does it every week.
Quality
A line can run at full speed and still produce scrap. Add quality and the measurement sits next to the order that was running, so a speed gain you pay back in rejects stands out.
Planning
Without planning you know what ran, not what should have run. Together they put planned next to actual and show you where the week slipped.
To see live tracking on the floor, read how Moerman NV went live on two machine lines in three months. The difference between recording and planning is explained in ERP vs. MES.
Put your entire shop floor on the same platform.
No 'big bang'. As a West Flanders-based team, we start at your SME with the first module on the first line, prove the value, and build out together to your full platform, at the pace and budget of an SME.